NeuroBridge
NeuroBridge
Machine Learning is the technological backbone for the NeuroBridge, and its parent-project, Digital Bridge. Currently, EMERGE is focused on LMIC (Low and Middle-Income Countries) areas that face severe challenges in the field of neurosurgery. To address these challenges, the EMERGE team has designed NeuroBridge, an innovative platform aimed at enhancing access to neurosurgical expertise and resources.
NeuroBridge leverages advanced machine learning algorithms to analyze patient data, identify treatment needs, and optimize surgical outcomes. By incorporating real-time data analytics, the platform produces severity and triage scores, improving decision-making processes for local healthcare providers.
The innovative approach of the NeuroBridge Project, highlights the global commitment to addressing disparities in healthcare access and quality, particularly within the field of neurosurgery. As part of EMERGE's mission, this initiative seeks to create sustainable healthcare solutions that can be adapted and scaled to meet the unique needs of various communities in LMICs.
The Machine-Learning Algorithm for Neurosurgical and Neurological Injuries
How Does NeuroBridge work?
Data Collection
NeuroBridge begins by collecting comprehensive data from the field. This includes:
Patient Demographics: Information such as age, gender, and medical history.
Mechanism of Injury: Specifics on how the injury occurred, which is crucial for accurate diagnosis and treatment planning.
Physical Exam Data: Detailed observations made during the neurological physical exam and initial patient assessment.
Real-Time Data Processing
Once the data is collected, NeuroBridge processes it in real-time using sophisticated machine-learning algorithms. Here’s how it works:
Input Data Analysis: The software examines the collected data, recoding it into gold standard neurological exam scales. Here, the software begins to identify key patterns and correlations that are critical for accurate diagnosis.
Algorithmic Scoring: NeuroBridge applies its machine-learning models to generate two primary scores:
Deficit Severity Score (DSS): Assesses the severity of the patient’s current neurological deficits.
This score is on a 1-5 scale, with a larger score indicating higher deficit.
Global Severity Score (GSS): Provides an overall assessment of the severity and level of criticality of the patient’s condition.
This score is on a 1-10 scale, with a larger score indicating higher severity and risk for long term injury.
Decision Support
The scores generated by NeuroBridge are then used to support healthcare providers in making informed decisions. This includes:
Rapid Triage: By quickly identifying the severity of injuries, healthcare providers can prioritize treatment for those in most critical need.
Treatment Guidance: The scores offer valuable insights into the best course of action for each patient, helping providers choose the most effective interventions.
Adaptability and Learning
NeuroBridge is designed to adapt and improve over time. It continuously learns from new data, testing and training data to refine its algorithms to better meet the needs of the community. This adaptability ensures that the software remains relevant and effective, even as healthcare challenges evolve.
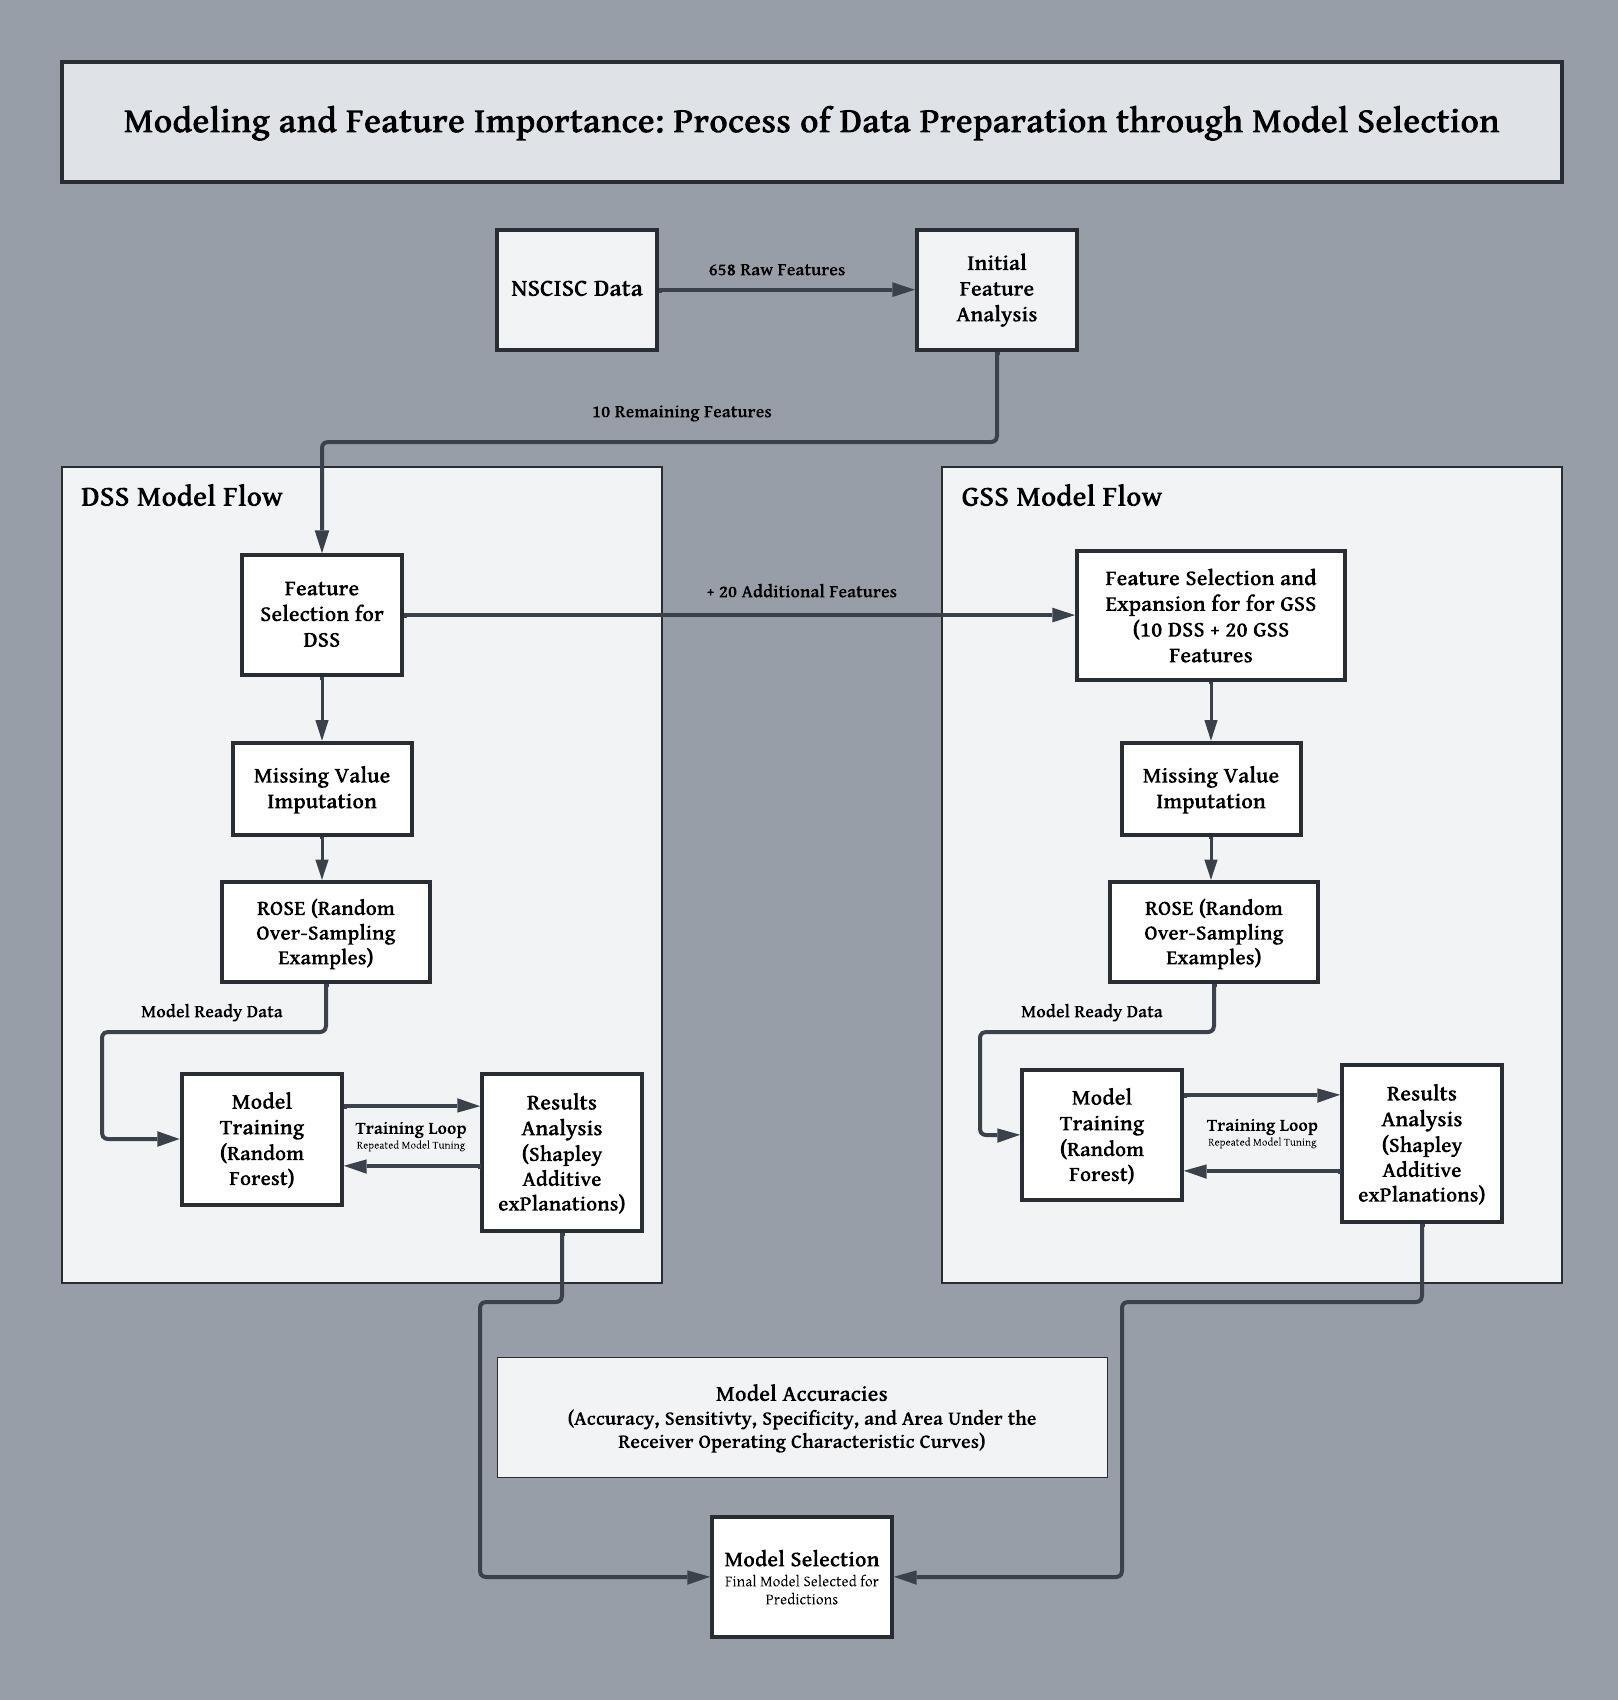
A peak into our algorithm.
How do we know if it works?
At EMERGE, we are working hard to train, test, tune, and evaluate the algorithm.
Test:Train the data sets
5-Fold Cross Validation
Confusion Matrix Evaluation
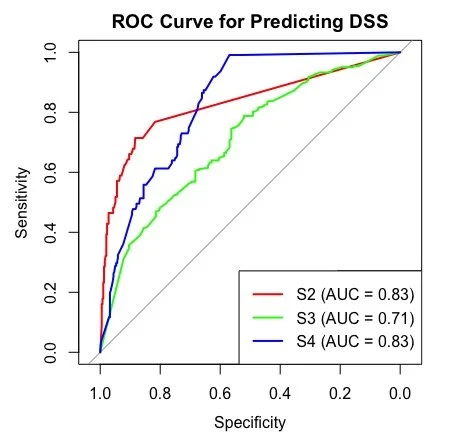
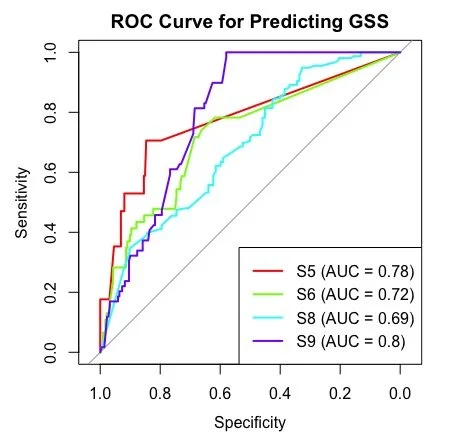
An example of our current performance measures are shown below.
Receiver Operating Characteristic Curves


